Phone and Doomscrolling Statistics Worth Knowing
Screen time and doomscrolling statistics with sources: hours per week, daily pickups and notifications, effects on sleep, teenage figures, and what platforms spend building it.
Statistics about phone use are usually quoted without sources and are frequently wrong. What follows is the set we rely on, each one linked to where it came from, with the methodology stated so you can judge it yourself.
How much time phones actually take
A July 2026 survey of 1,000 U.S. adults reported an average of 4 hours 5 minutes of smartphone screen time a day. That's self-reported, and self-reported screen time tends to run lower than measured screen time, so treat it as a floor.
Put across a week, 4h 5m a day is 28 hours 35 minutes. The comparison that lands hardest is against the rest of the week:
| Where the 168 hours go | Hours per week |
|---|---|
| Sleep, at 8 hours a night | 56 |
| Work, at a 40 hour week | 40 |
| Phone screen time | 28h 35m |
| Everything else | 43 |
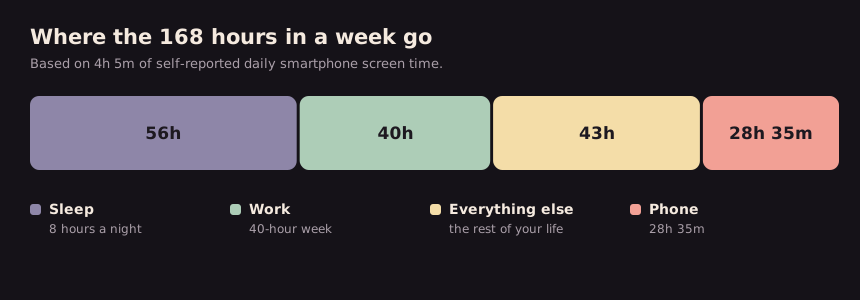
So for a working adult sleeping eight hours, the phone takes roughly two thirds as much waking, non-working time as everything else combined. Not most of your life. A larger share of what's left than most people would guess.
How often you reach for it
Total hours hide something important, which is that the time doesn't arrive in one block. The same Reviews.org research found Americans pick up their phones 186 times a day.
Across sixteen waking hours, that's roughly once every five minutes. It reframes the problem. Four hours spent in four sittings would be an ordinary hobby. The same four hours split into 186 fragments is something else, and it's the fragmentation rather than the total that makes people describe their attention as broken.
A good share of those pickups are prompted. The average US smartphone user receives about 46 push notifications a day, according to Business of Apps research from June 2026. Each one is an invitation to start a session you weren't planning.
How much of it nobody chose
This is the figure I find hardest to dismiss. Virgin Media O2 ran a year-long study of more than 6,000 people and found that 36% of phone use happened without a clear purpose.
Applied to a 4 hour day, that's about 1 hour 26 minutes daily of use that wasn't chosen. Not time spent on something you decided was worth it. Time that simply happened.
The distinction matters more than the total. Four hours of deliberate use is a preference. Ninety minutes of unintentional use is a design outcome.
How common doomscrolling is
In a 2025 survey of 1,002 Americans, nearly two in three described themselves as doomscrollers, and 43% said they did it daily.
Self-identification is a soft measure, and people may be generous with the label. It still tells you the experience is close to universal, which is worth knowing if you've been treating it as a personal weakness.
What it does to sleep
Sleep is where the evidence gets least ambiguous, mostly because sleep is easier to measure than mood.
Start with proximity. The American Academy of Sleep Medicine reports that 87% of Americans sleep with their phone in the bedroom, and that more than a quarter say they prioritize screen time over getting the recommended amount of sleep.
The measured cost is real but smaller than the headlines suggest. Summarizing recent research, the AASM notes that people using screens before bed slept roughly 50 minutes less per week and had a 33% higher rate of poor sleep quality than those who avoided them. Fifty minutes a week is about seven minutes a night, which is worth having and is not a catastrophe.
What's more striking is the dose-response pattern: each additional hour of screen time after getting into bed was associated with a substantially higher chance of insomnia symptoms. The relationship scales, which is the sort of pattern that makes researchers take a correlation more seriously.
Teenagers get the worst of it
If the adult numbers seem high, the numbers for young people are on another scale. Common Sense Media tracked around 200 people aged 11 to 17 for nine days in its Constant Companion study.
| Measure | Median |
|---|---|
| Notifications per day | 237 |
| Share arriving during the school day | About a quarter |
| Share arriving overnight | 5% |
| Phone use during school hours | 43 minutes |
237 notifications is a median, so half the participants got more, and some received well over a thousand. The overnight 5% matters more than its size suggests, because those arrive during sleep, and the school-day quarter lands during the hours we specifically ask young people to concentrate.
What you're up against
The other side of this is rarely quantified. Combined research and development spending reported by four platform companies for 2025, from their annual filings:
| Company | Source |
|---|---|
| Meta | 2025 Form 10-K |
| Alphabet | 2025 Form 10-K |
| Snap | 2025 Form 10-K |
| 2025 Form 10-K |
Together, more than $121 billion. An obvious caveat: R&D covers everything from data centers to hardware to advertising infrastructure, and it would be dishonest to present all of it as spending on engagement. The relevant point is the asymmetry. On one side, thousands of engineers and a budget larger than most countries' research spending. On the other, one person deciding to be more disciplined this evening.
For a regulator's view of how these systems are built and what they collect, the FTC's Social Media and Video Streaming Services 6(b) report is the most substantial public document available.
Check your own numbers
Every figure on this page is an average, and averages are a poor guide to your own life. Your iPhone has been measuring you this whole time, and its data beats any survey here because it's measured rather than remembered.
Open Settings → Screen Time → See All App & Website Activity. Three things are worth more than the headline total:
- Pickups. How many times a day you start a session, and which app you open first. That first-open app is usually the habit, whatever your total says.
- Notifications. Sorted by app, this is the clearest list of which services are initiating contact with you rather than the other way round. It's also the fastest thing to fix.
- Weekday against weekend. A large gap suggests context and boredom are driving it. A flat line suggests something more habitual.
Look before you change anything. The most common outcome is discovering the problem isn't the app you assumed it was.
Reading these honestly
- Self-reported screen time understates reality. People underestimate, sometimes by a lot. Your iPhone's own Screen Time figure is better data than any survey here.
- Watch how much the figures disagree. The 186 daily pickups above sits alongside widely circulated claims of 352 a day. Both get quoted confidently. They almost certainly define a pickup differently, and neither cites the other. When two numbers about the same behavior differ by nearly double, the definition is doing more work than the finding.
- Averages hide the distribution. A 4 hour average includes people at 1 hour and people at 9. Yours is the only number that matters for your decisions.
- Correlation dominates this field. Most research linking screen time to mood is correlational, and the causal direction is genuinely unclear. Feeling low leads to more scrolling as reliably as the reverse.
- Time isn't automatically the problem. Two hours of messaging people you care about isn't equivalent to two hours of unintentional feed. Intent is the more useful measure, which is why the 36% figure is the one worth carrying around.
If the unintentional-use figure is the one that lands for you, how to stop doomscrolling covers what to do about it.
Frequently asked questions
How much time does the average person spend on their phone?
A July 2026 survey of 1,000 U.S. adults reported an average of 4 hours 5 minutes of smartphone screen time per day, which works out to about 28 hours 35 minutes a week. Self-reported figures generally understate actual measured use, so this is best treated as a floor.
How much phone use is unintentional?
A year-long Virgin Media O2 study of more than 6,000 people found that 36% of phone use happened without a clear purpose, which is roughly 1 hour 26 minutes a day for someone averaging four hours.
What percentage of people doomscroll?
In a 2025 survey of 1,002 Americans, nearly two in three described themselves as doomscrollers and 43% reported doing it daily. This is self-identification rather than measured behavior, so it indicates how widely recognized the experience is rather than precise prevalence.
How many times a day does the average person check their phone?
Reviews.org's 2026 research puts it at 186 pickups a day for Americans, which is roughly once every five waking minutes. Other widely quoted figures go as high as 352 a day. The gap almost certainly comes from different definitions of what counts as a pickup, so treat any single number here with caution.
How many notifications does the average person get per day?
Business of Apps research from June 2026 puts the average US smartphone user at about 46 push notifications a day. Teenagers receive far more: Common Sense Media measured a median of 237 a day among 11 to 17 year olds, with roughly a quarter arriving during the school day and 5% overnight.
Does using your phone before bed actually affect sleep?
Yes, though less dramatically than headlines suggest. The American Academy of Sleep Medicine reports that people using screens before bed slept about 50 minutes less per week and had a 33% higher rate of poor sleep quality. That's around seven minutes a night. More notable is the dose-response pattern, where each extra hour of screen time after getting into bed is associated with a substantially higher chance of insomnia symptoms.
How do I check my own screen time on iPhone?
Open Settings, Screen Time, then See All App & Website Activity. Beyond the headline total, look at pickups (how many separate sessions you start and which app you open first), notifications by app, and the difference between weekdays and weekends. This measured data is more reliable than any survey average.
How much do social media companies spend on their platforms?
Meta, Alphabet, Snap, and Reddit reported a combined figure above $121 billion in research and development for 2025 in their annual SEC filings. R&D covers far more than engagement design, including infrastructure and hardware, so the figure illustrates scale rather than measuring spending on attention specifically.
Is screen time actually bad for mental health?
Research consistently finds correlations between heavy passive social media use and lower mood or worse sleep, but most of it is correlational and causation runs in both directions. Low mood drives scrolling as reliably as scrolling drives low mood. Whether the time was intentional appears to matter more than the raw total.